
A Manager's Guide to Reducing AI Costs Without Reducing Headcount
The budgeting math Uber didn't do and why you should this quarter.

“I’m back to the drawing board, because the budget I thought I would need is blown away already.”
That was Uber’s CTO, Praveen Neppalli Naga, speaking in April 2026. His engineering team had consumed Uber’s entire annual AI budget in four months. The deployment was working. The budget was not. Uber had built the budget around a mental model that does not apply to AI.
Why budgets break for AI?
For the past 20 years, SaaS has had a fixed cost: a seat, a subscription, a license. Usage at the margin is free. The more people use it, the better the ROI. That model worked for twenty years of SaaS. It does not work for AI.
Every token processed costs money, and the bill scales with how people use the tool, not with how many of them have access. Uber gave 5,000 engineers access to Claude Code in December 2025. Within three months, 84% were running agentic workflows, which chain dozens or hundreds of model calls per task. The bill scaled with that behavior.
The incentive structure made the gap worse. Internal leaderboards ranked engineers by AI usage, so engineers used more of it. The bill climbed to match.
How AI costs scale: The three axes
An AI budget has three axes, and they do not add. They multiply.
Users. How many people have access.
Task complexity. What a single interaction consumes. This is the axis most forecasts ignore, and it is where the order-of-magnitude error enters.
Frequency. How many interactions per user per day.
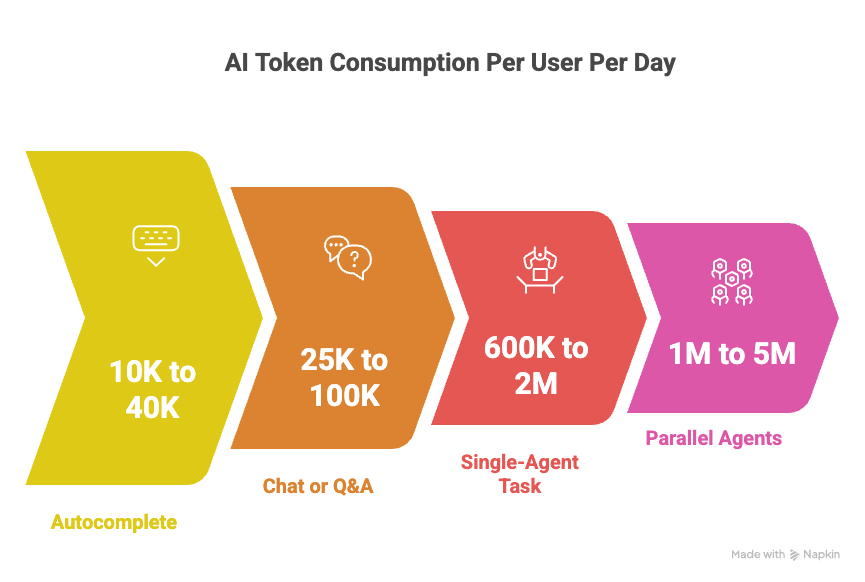
Here are the rough benchmarks a manager should carry in their head. These are typical ranges for current frontier-model deployments, not published standards:
Autocomplete or single-turn suggestion: ~500 tokens per interaction, 20 to 80 interactions per user per day. Roughly 10K to 40K tokens per user per day.
Chat or Q&A: ~5K tokens per conversation, 5 to 20 per user per day. Roughly 25K to 100K tokens per user per day.
Single-agent task: ~200K tokens per run (context plus tool calls plus iteration), 3 to 10 runs per user per day. Roughly 600K to 2M tokens per user per day.
Parallel or deep-research agents: 1M to 5M tokens per run, because the orchestrator plus subagents each carry their own context. Runs per day are lower, but each run is a major line item.
Uber’s 5,000 engineers, if budgeted at the per-seat rates typical of traditional developer tools, would have projected a fraction of what they actually consumed.
How your AI Budget is broken down
Most managers budget the model API line item and miss the rest of the stack. Here is what the rest typically costs, as a percentage of visible inference spend:
Embeddings API calls: 3 to 8%. Every retrieval-augmented feature runs embeddings on the query and on the stored documents. Often billed on a separate line, so it disappears from the “AI cost” conversation.
Vector database hosting and queries: 5 to 12%. Scales with corpus size and recall strategy. Goes up sharply when someone decides to improve retrieval quality.
Observability and tracing (LangSmith, Langfuse, Arize, Datadog LLM): 5 to 15%. Traces are stored per call. Agentic workflows generate 10 to 100× more traces than chat workflows.
Evaluation runs: 10 to 20% blended across iteration and steady state. Every prompt change is re-run against an eval set. Nobody budgets for this line item in year one.
Fine-tuning or retraining compute: episodic, adding 10 to 20% annualized, and spiking above 30% during an active retraining quarter. Often triggered by quality drift, which is itself not scheduled.
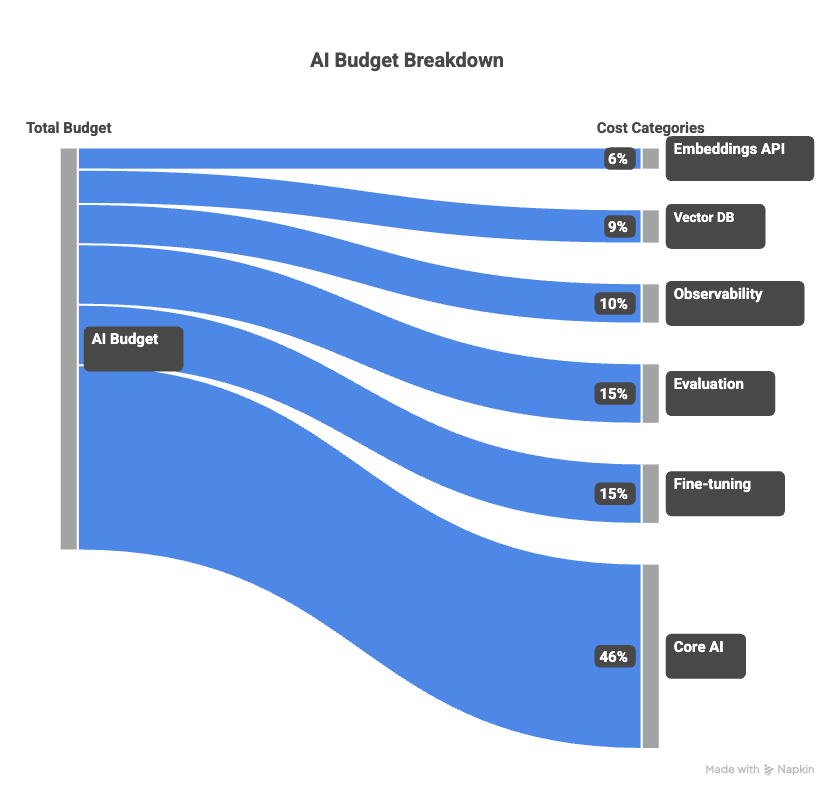
Rule of thumb: if your visible model API bill is $X, plan for a true total cost of $1.4X to $1.6X in steady state, and up to $1.8X during retraining cycles.
Why next month’s consumption >> this month
The second most common forecasting error is assuming that a user’s consumption this month equals their consumption next month. In a maturing AI deployment, per-user consumption drifts upward for three compounding reasons:
Workflow migration. Users start at the easiest entry point, usually autocomplete or simple chat. They discover chat. They discover agents. Each step up the complexity ladder is a 5 to 20× increase in tokens per interaction, and it happens without any change in headcount.
Skill growth. A user who has learned to write effective agent prompts runs more complex tasks. Per-interaction cost grows even within the same workflow category.
Product pressure. Every AI product team ships features to increase engagement. The feature team’s incentive is to drive usage up. The finance team’s assumption is that usage stays flat.
If your deployment is six months old and your per-user consumption matches month one, either your forecasting is unusually lucky, or your adoption is stalled. Neither one is a safe assumption to build next quarter’s budget on.
A defensible budget models at least one phase transition. For an internal AI platform serving several thousand users, a realistic trajectory looks like this: in month one, users run single-shot queries; in month three, they adopt multi-turn sessions; in month six, they are chaining tools and running overnight agents. At the same headcount, per-user cost can grow 10 to 30× across that six-month window.
The 10/70 rule: 10% of users generate 60% to 75% of tokens
In every mature AI deployment worth studying, a small fraction of users drives the majority of token consumption. The shape is predictable enough to plan for: roughly 10% of users generate 60 to 75% of tokens. These are the engineers who run agents overnight, the analysts who chain deep-research queries, the power users who build their workflow around the tool.
Meta’s leaderboard incident was the pathological version of this pattern. Employees left agents running for hours with no real task, because the ranking incentive was stronger than the work itself. The 10/70 distribution shows up even without a broken incentive, though. It is the natural shape of how humans use a tool whose cost varies per interaction.
Two implications for your budget:
Model the top 10% at 10 to 30x the median user’s consumption. If your budget assumes uniform usage, you are building it on a distribution that has never been observed in production.
Track the concentration ratio as a metric in its own right. When top-decile usage starts pulling away from the median faster than it already does, that is a leading indicator of a budget overshoot six to twelve weeks away.
The unit-economics to run before you deploy
Budget forecasting for AI does not require a finance team. It requires running one unit calculation before the deployment decision, not after.
Start with a single interaction in your most important use case, then estimate:
T = tokens per interaction for a typical (median) user
P = price per token (blended input/output rate for your chosen model)
F = interactions per median user per day
D = working days per month (22 is conventional)
U = active users
H = hidden-layer multiplier (start at 1.5)
C = concentration factor to lift the median up to the mean (start at 1.3 to account for the heavy-user tail)
Monthly cost ≈ T × P × F × D × U × H × C
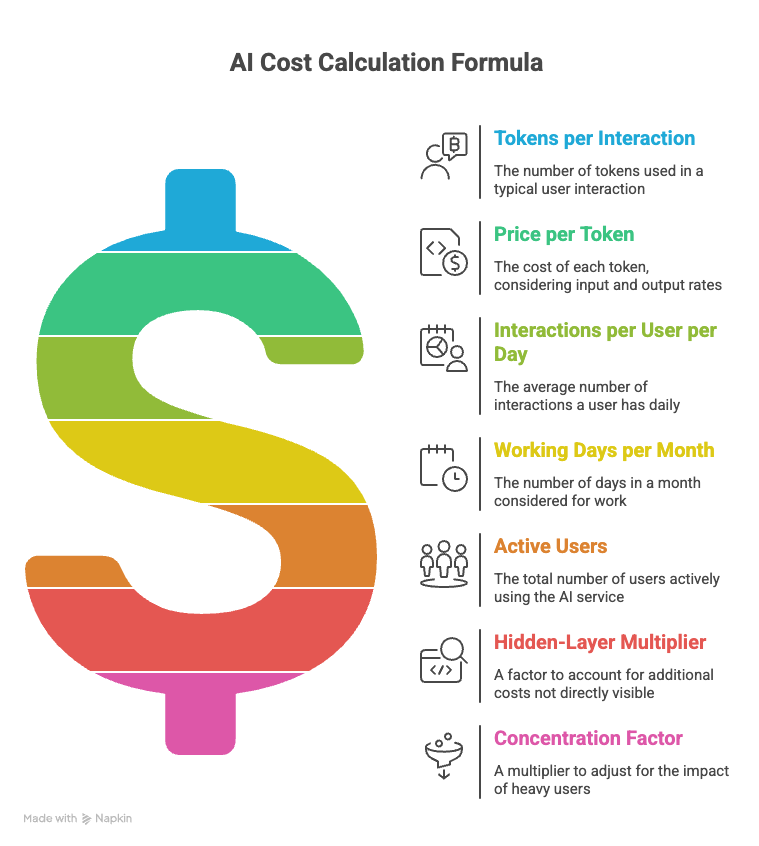
T and F are calibrated on the median user because the median is who you can actually observe in the first weeks of a pilot. C is the correction that turns a median-user forecast into a total-population forecast, given the 10/70 distribution.
If you already have a running deployment, pull actual token counts from the provider’s usage API or response headers and aggregate them by user for two weeks before forecasting. If you do not yet have a deployment, run a 50-user pilot for two weeks and measure. Anything earlier than that is guessing at T.
A solid worked example
Using illustrative pricing around $5 per million tokens (blended), for 500 engineers on a chat-dominant workflow:
T = 5,000 tokens, F = 10, D = 22, U = 500, H = 1.5, C = 1.3
Monthly tokens: 5,000 × 10 × 22 × 500 × 1.3 ≈ 715M
Monthly cost: 715M × $5/M × 1.5 ≈ $5,400
Now the drift scenario, same team on an agent-dominant workflow:
T = 200,000, F = 5, D = 22, U = 500, H = 1.5, C = 1.3
Monthly tokens: 200,000 × 5 × 22 × 500 × 1.3 ≈ 14.3B
Monthly cost: 14.3B × $5/M × 1.5 ≈ $107,000
Nothing changed except task complexity. The bill moved by roughly 20x, on the same team, the same product, the same headcount. This is the calculation Uber would have wanted to run in November 2025. It takes a spreadsheet and an afternoon.
How should you cut the build?
A manager has four controls that change the run-rate without changing who has access. Pulling two or three of them in combination can reduce a deployment’s cost by 40 to 70%.
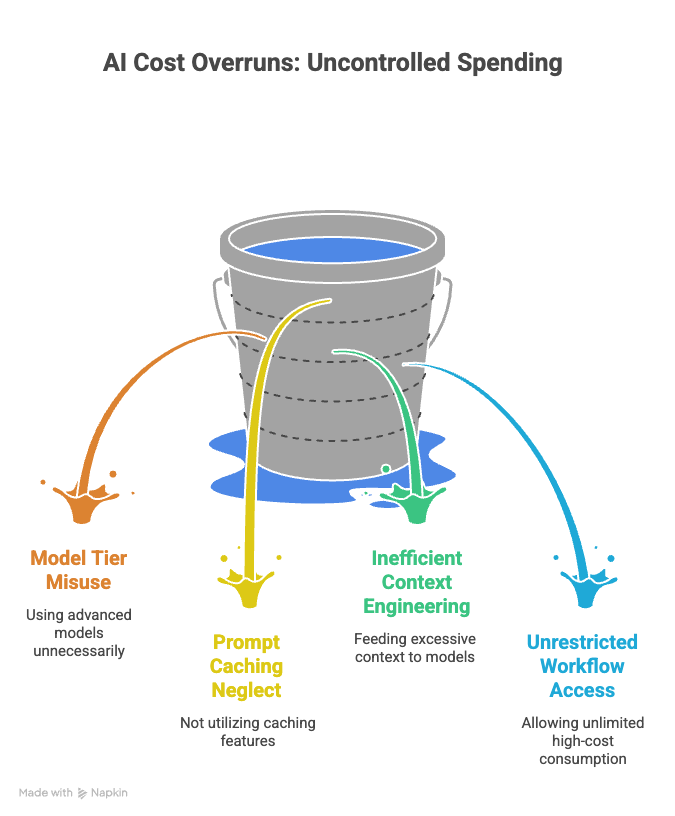
Model tier. Within a single model family, price varies roughly 10x across tiers (Haiku to Sonnet to Opus, or the equivalent with any other provider). Most deployments route everything to the most capable tier because it was the default in the prototype. Audit each workflow and route it to the cheapest tier that clears the quality bar. Classification, routing, summarization, extraction, and most tool-use decisions do not need frontier-class models.
Prompt caching. Modern providers cache repeated context such as system prompts, knowledge base chunks, and tool definitions, and charge 10 to 20% of the normal rate on cache hits. Well-instrumented deployments see a 50 to 90% reduction in effective cost on repetitive workloads, because most of a typical prompt is the same from call to call.
Context engineering. Every token of context is a token you pay for on every call. Feeding the model a 50K-token dump of “everything that might be relevant” costs roughly 10x what feeding it the 5K-token subset that is actually relevant costs. Investment in retrieval quality pays back in both output quality and bill size.
Workflow gating. Not every user needs access to every workflow. Restricting parallel-agent workflows to a named list, or requiring approval above a per-run token threshold, caps the distribution tail without slowing down typical use. The goal is not to prevent power users. It is to make high-cost consumption a deliberate choice rather than a default.
Each of these moves the effective P or T in the formula. None of them require a headcount decision, a license renegotiation, or a vendor conversation.
Weekly metrics that you should track
Annual budget tracking cannot catch AI cost drift. By the time the quarterly review surfaces the problem, the next quarter’s invoice is already queued. These are the leading indicators worth tracking on a weekly cadence:
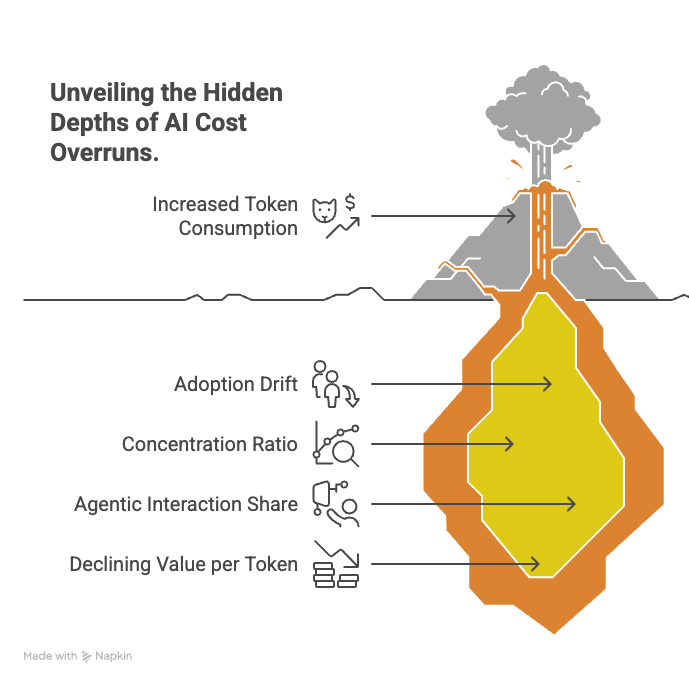
Tokens per active user per week. Watch this as a time series, not a total. Flag any sustained run of 15%+ week-over-week growth across three or more weeks with no feature launch to explain it. That is adoption drift.
Concentration ratio. What share of tokens comes from the top 10% of users. Rising concentration means your budget risk is concentrating too.
Share of tokens from agentic interactions. Track the transition from chat to agent as its own metric, because it is the single biggest cost-per-interaction inflection in your deployment.
Value per 1,000 tokens. Pick a business denominator: tasks completed, tickets resolved, revenue touched. If this number is flat or declining while consumption grows, the economics are inverting.

One measurement trap to avoid: do not use token consumption as a proxy for adoption success. Every token of consumption is also a dollar of cost, so when consumption becomes the measure of adoption, the organization has built a machine that optimizes for its own bill.
Meta learned this at 85,000 employees, when leaderboard-ranked staff started leaving agents running for hours with no task to improve their standing. The fix is to track what users produce (tasks completed, tickets resolved, code shipped) rather than what they consume.
The 3x value test before you ship an AI feature
The final guardrail is a number the feature has to clear in order to exist. A reasonable practitioner heuristic: the feature should return at least 3x its fully-loaded compute cost in measurable user value.
Pick the denominator honestly. For an engineering tool, that is hours saved multiplied by loaded engineer cost. For a support agent, resolution without escalation multiplied by the cost of a human escalation. For a content feature, writer-equivalent output multiplied by writer-equivalent cost. If you cannot articulate what 3× looks like for your specific use case before shipping, the economics are not clear enough to ship.
Cursor runs roughly $1B in revenue at -30% gross margins, paying $1.30 in Anthropic API fees for every dollar of subscription revenue it collects. OpenAI’s Sora cost $15M per day in compute and earned $2.1M in lifetime revenue before being shut down with thirty minutes’ notice to Disney, who had just signed a reported $1B licensing deal. Across enterprise pilots more broadly, 80% fail to deliver measurable business value, and the average failed project costs $6.8M and returns $1.9M.
FAQ
Does this framework apply to non-Anthropic models?
Yes. Every frontier-model provider (OpenAI, Google, Meta’s open-weights) bills on consumption. The benchmarks and multipliers in this piece are about deployment shape, not a specific pricing sheet. Swap in your provider’s per-token price for P in the formula, and the rest holds.How often should I re-forecast?
At minimum, re-run the formula at each workflow-mix phase transition (roughly every two to three months in an active deployment). The weekly metrics section exists so you can see phase transitions early, not wait for a quarterly review to surface them.What if my pilot is too small to produce stable token numbers?
A 50-user, two-week pilot is the minimum that produces defensible median-user estimates. Below that, you are extrapolating from noise. If you cannot run a 50-user pilot, run a 10-user pilot, measure, and double the buffer in your forecast by setting H to 2.0 and C to 1.8.Should I use per-user caps or per-team budgets?
Per-team budgets match how the 10/70 distribution actually behaves. Per-user caps feel fair but end up throttling the 10% of users who generate the most value along with the 10% generating the most waste. A team budget with workflow gating on the most expensive operations concentrates the constraint where cost actually concentrates.